
In this tutorial, you will learn how to create reports in Visual Studio. We are going to used ReportViewer and show you the steps with images.
Let’s Start:
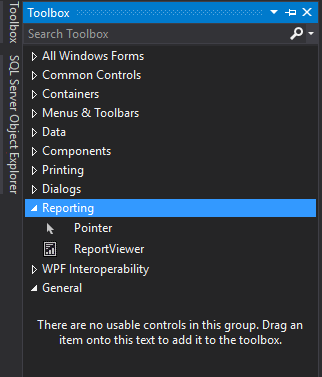
1. Open your Visual Studio editor and create a new Windows Application. Add form to your project and navigate to the toolbox to add ReportViewer tools. Drag and drop the tools to your form.
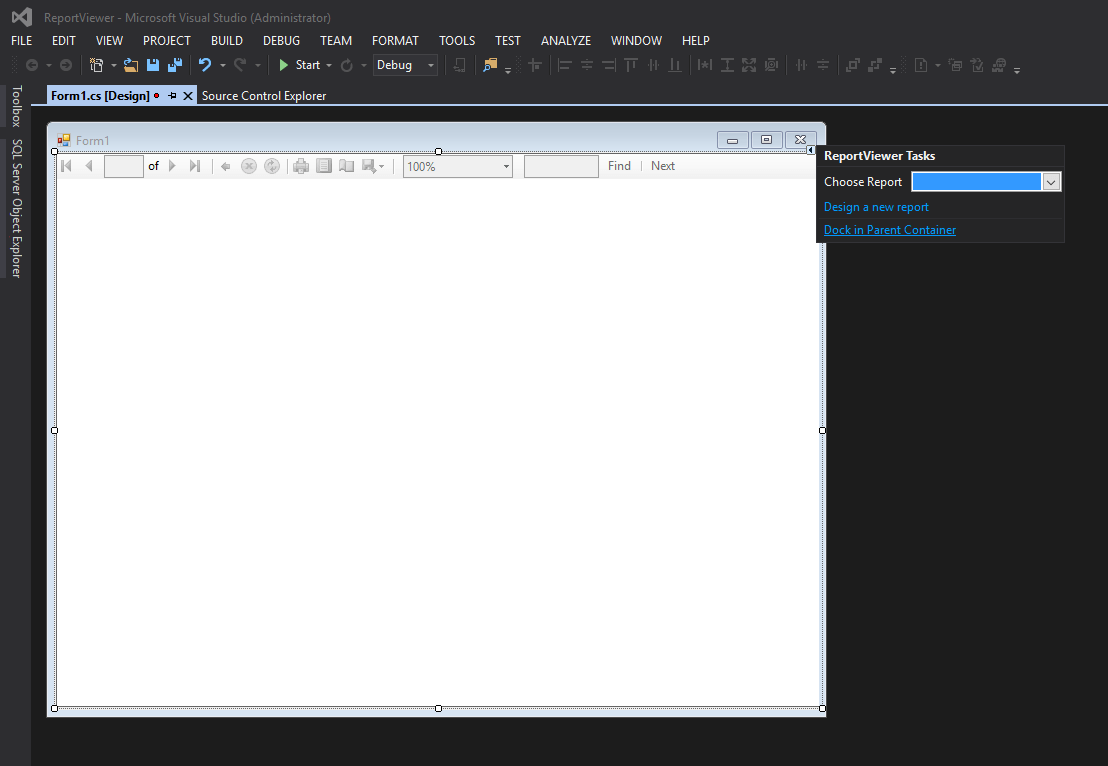
2. Dock ReportViewer to your form. Like the image below.
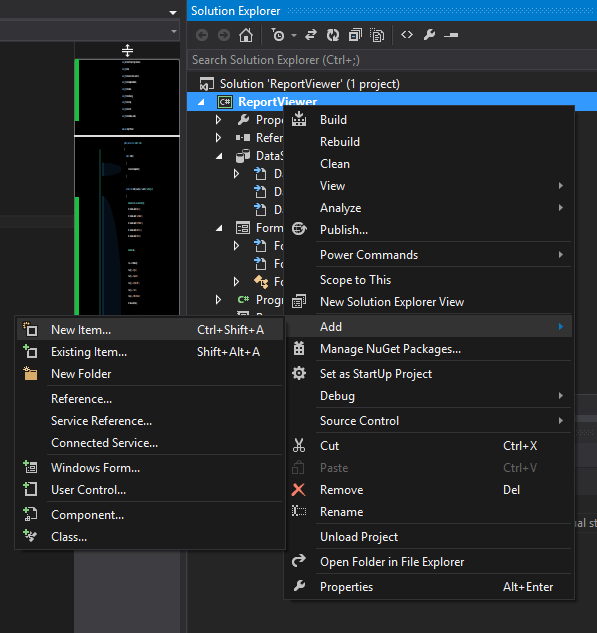
3. Add Dataset to your project by simply right clicking on your project name and selecting Add-New Item
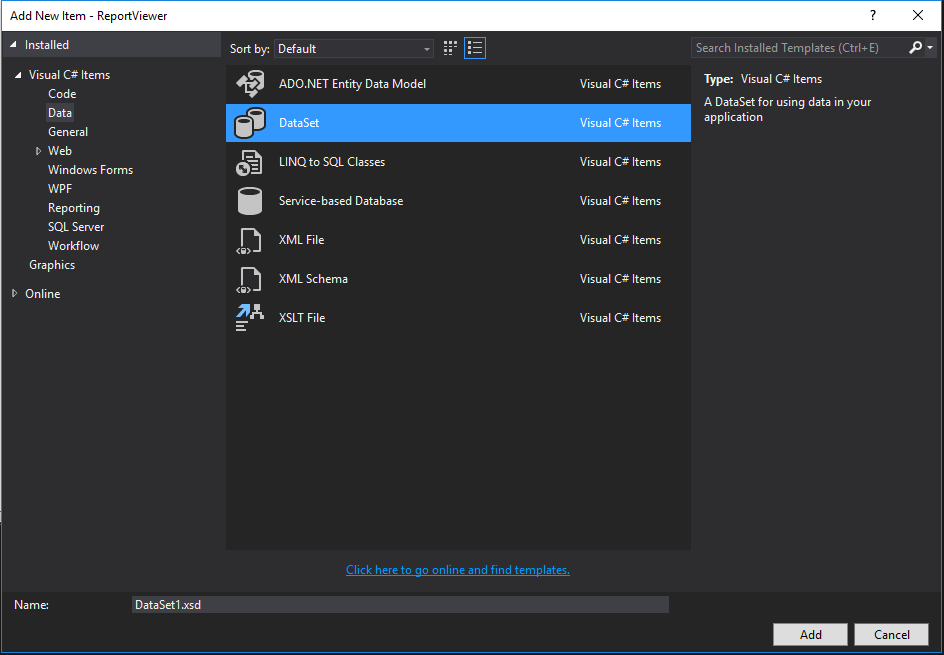
4. Select data from the left pane and search for Dataset from the middle pane
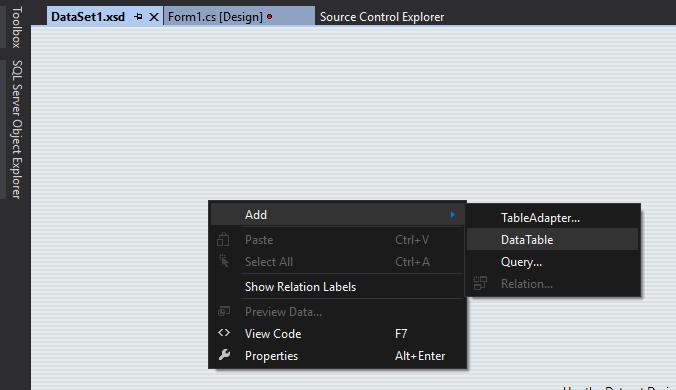
5. Open Dataset you just added and add DataTable. See image below.
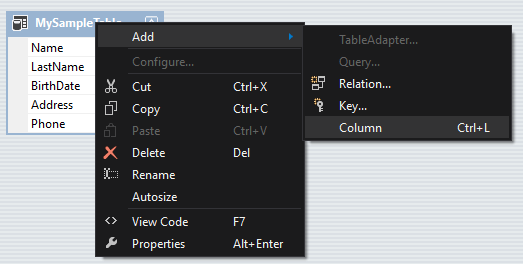
6. Add a column to your table.
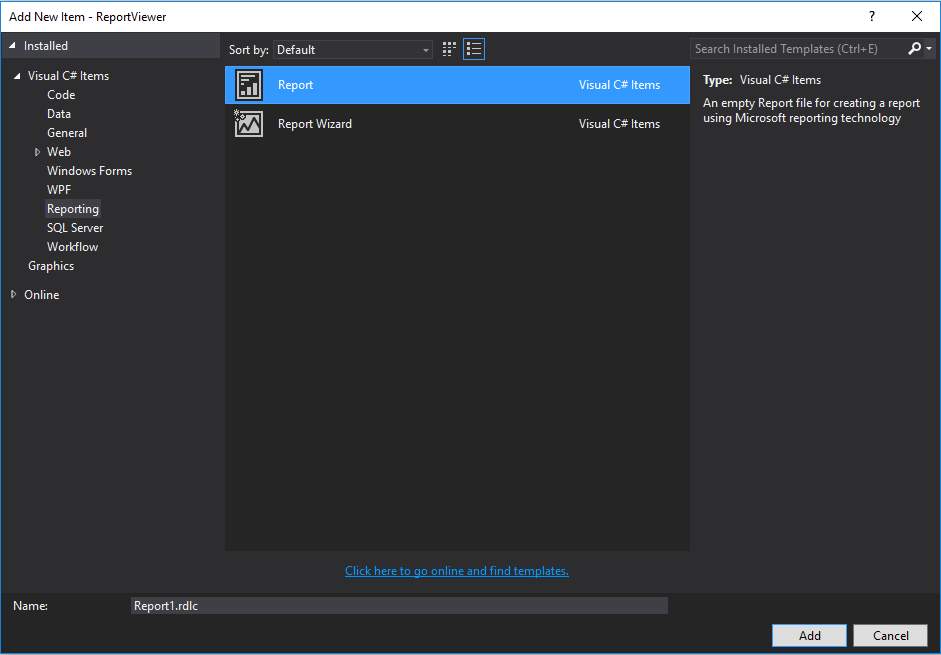
7. Add Report to your project (RDLC file). Right-click again on your project name in your solution explorer. Choose Add from the pop-up option and select New Item. On the dialog, select Reporting from the left pane and choose Report from the middle pane.
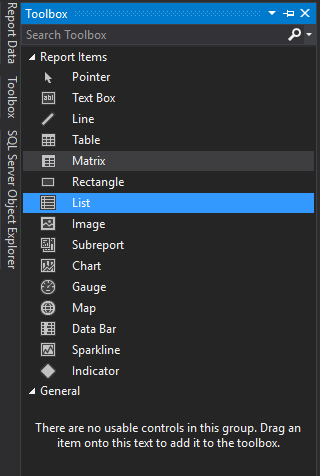
8. Open your RDLC report then add List tools from your toolbox located on the left side of your RDLC designer.
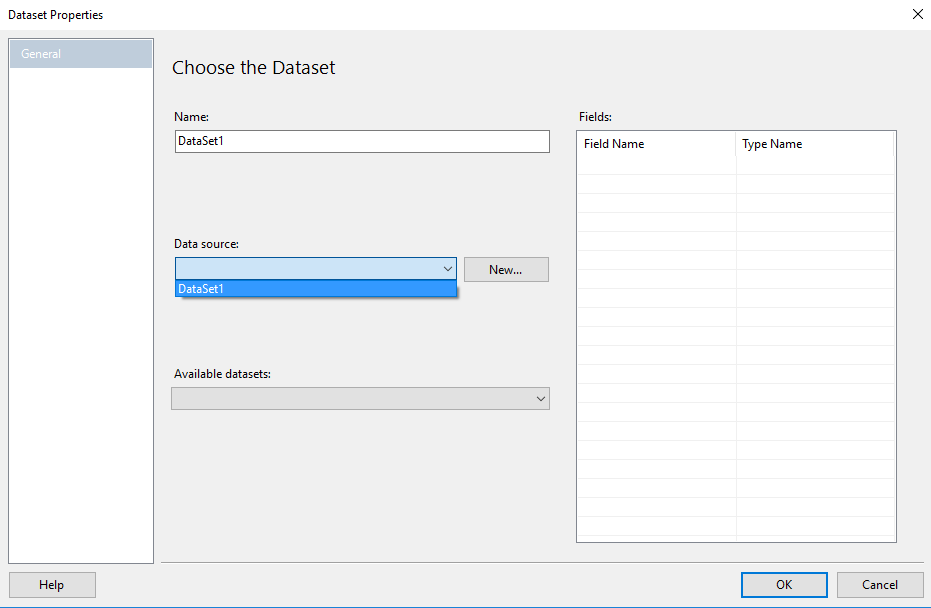
9. Choose Dataset for your List Table. In my case it is Dataset1.
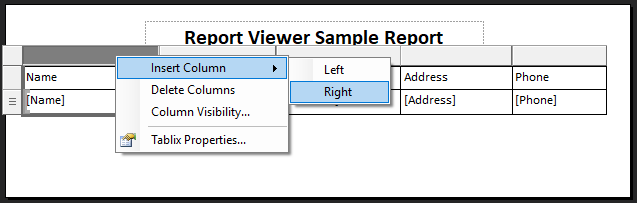
10. Add a column to your list by simply right clicking on any cell and selecting Insert Column.
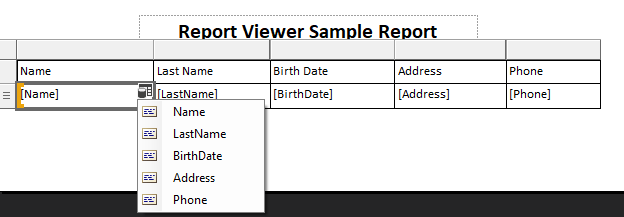
11. Manually add column name to your List Table from your DataTable. See image below.
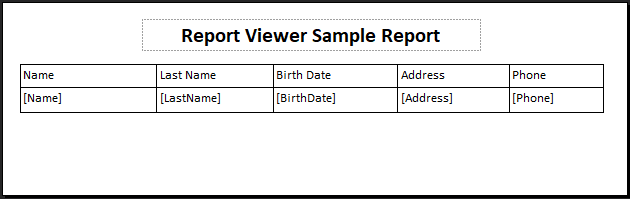
12. This is my final view of the design for my RDLC report.
13. To add Data to our list and display it in our report viewer from our form. Copy the code below. I write my code inside the form load event.
Note:
ReportViewer.Report1.rdlc
| ReportViewer | Name of my project |
| Report1.rdlc | Name of the RDLC report |
| DataSet1 | Dataset Name |
private void Form1_Load(object sender, EventArgs e)
{
    //Create Sample Data for our reportviewer
    DataTable dt = new DataTable();
    dt.Columns.Add("Name");
    dt.Columns.Add("LastName");
    dt.Columns.Add("BirthDate");
    dt.Columns.Add("Address");
    dt.Columns.Add("Phone");

    DataRow row;

    row = dt.NewRow();
    row[0] = "Regie";
    row[1] = "Baquero";
    row[2] = "01/01/2017";
    row[3] = "Cebu";
    row[4] = "09012545458";
    dt.Rows.Add(row);
   //end of creating sample data

    DataSet ds = new DataSet();
    ds.Reset();

    reportViewer1.Reset();
    ds.Tables.Add(dt);
    reportViewer1.RefreshReport();
    reportViewer1.LocalReport.ReportEmbeddedResource = "ReportViewer.Report1.rdlc";

    ReportDataSource rds = new ReportDataSource("DataSet1", ds.Tables[0]);
    reportViewer1.LocalReport.DataSources.Add(rds);
    reportViewer1.LocalReport.Refresh();
    reportViewer1.SetDisplayMode(DisplayMode.PrintLayout);
    reportViewer1.ZoomMode = ZoomMode.Percent;
    reportViewer1.ZoomPercent = 100;
    reportViewer1.Refresh();

    this.reportViewer1.RefreshReport();
}
14. Run your project by simply clicking F5 on your keyboard.
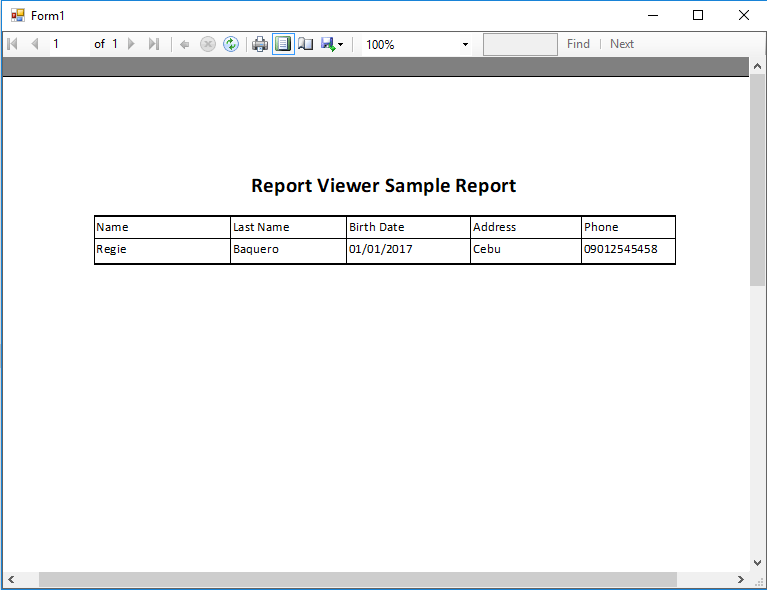
That’s it. You have successfully created a report using reportviewer. Hopes this helps. Happy Coding!!